Green Sand Control Best Practices for a Metalcasting Foundry
- Hill and Griffith

- Dec 28, 2016
- 5 min read
(This post is from a March 2015 article that ran in MODERN CASTING by Al Jacobson, Grede-St. Cloud, St. Cloud, Minnesota.)
Regular sand tests performed at Grede-St. Cloud helped identify variations and reduce their causes to achieve better operation.
(Click here to see the story as it appears in the March issue of Modern Casting.)
Green sand control best practices in a metalcasting facility relies on reducing the variation in key measurable aspects of sand properties. All metalcasting facilities make good sand at times and bad sand at times. Successful plants make good sand most of the time.

Reducing variation in green sand systems consists of determining the key independent variables, finding a method to quantify current variation and implementing improvements to reduce variation and monitor the results.
Grede-St. Cloud, a green sand molding operation producing iron castings, operates two molding lines, each with its own sand system. For each line, daily tests are used to quantify variation within the sand system and make corrections as needed to keep within the optimal performance range.
Monitoring Compactibility
Key independent variables are those aspects of the sand system that can be adjusted easily. For instance, the level of compactability (one of the key independent variables in green sand control) can be adjusted simply by setting the system to target a lower or higher number. The operator has total control.
At Grede-St. Cloud, a 3-ram manual tester (rammer method) and an automatic compactibility tester are used. The automatic tester is in the sand system on the muller itself, while the sand lab performs the 3-ram test from the sand at the mold. Although some facilities may opt to only run the automatic tester, also including a manual test in the lab at some frequency will help check the accuracy of the automatic tester. Additionally, sand properties can change during the time it comes out of the muller to when it reaches the mold. Testing automatically at the muller and then manually at the mold can tell you how much your sand is drying out or losing compactibility from muller to mold.

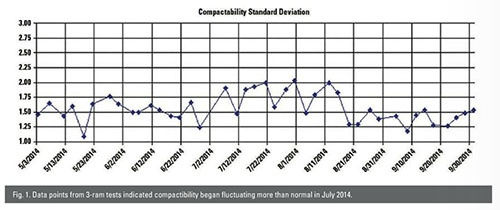
The current variation in a sand system can be quantified by defining it with a standard deviation. Fig. 1 shows a standard deviation for compactibility using the 3-ram testing method at Grede-St. Cloud. Each data point represents the average of 30 3-ram tests. Thirty tests are used because that is considered a statistically sound sample size. As seen in the chart, the metalcasting operation was running in control in May and early June but then veered out of control in July.

This alerted Grede to investigate for equipment malfunctions. Grede found and repaired the mechanical issues in the system, after which the system went back into control. The chart plotted from the automatic tester over the same period confirmed the variation trend indicated by the 3-ram tests (Fig. 2).

Hartley tests and results can be used in the same way. The histogram from a Hartley test in Fig. 3 shows how many tests ran in an eight-hour time period. In this case, 197 tests ran in eight hours, 94 of which were +/-2 points from the target and 192 of which were +/-3 points from the target. Tests on compactibility should be performed daily to quantify and identify variation within the system.

Compactibility can be improved by reducing the variation of return sand conductivity or moisture. Figure 4 shows the conductivity fluctuations from muller batch to muller batch on one of Grede-St. Cloud’s molding lines. The wide fluctuations occurred through October 2012 and then became much tighter in the following months. The improvement stemmed from the purchase of a new piece of equipment to replace a cooler moisture addition system that was not adding the right amount of water. The data shows the new equipment made a positive impact on return sand conductivity, which typically will improve variation on compactibility at the mold line.
Checking the Clay
A second key independent variable in green sand is the amount of live clay present in the sand, which is identified with the methylene blue clay test at Grede-St. Cloud. The amount of live clay, which is critical to binding a green sand mold, is considered an independent variable because most sand casting facilities have an auger speed or weight they use to set the amount of clay to go into the muller.

In Fig. 5, each dot represents the average of 30 methylene blue clay tests. The fluctuation shown here was caused by equipment error. In the mixer, clay is added via a mixer and when it stops, sometimes extra clay falls into the auger. Years ago, Grede-St. Cloud had installed a slide gate to prevent that from happening, but it was discovered the slide gate stopped working. Once the slide gate was fixed, the variation in live clay amount went back down.

After keeping tabs on its live clay variations for some time, Grede-St. Cloud moved to a mass balance system in which it calculates based on a formula of how much clay will be lost when running a specific job. That calculation is used to determine how much new clay will be added for each job. This calculation is made for every job that runs through the facility. It has proven to significantly reduce variation in the methylene blue clay test results (Fig. 6).
Watching Size Distribution
A third key independent variable to measure is the size distribution of washed green sand. Size distribution is not as easy to control because new sand is a product supplied by a vendor, not something you can change in-house. But metalcasting facilities should try to control size distribution because it has a big effect on the sand system.
Size distribution can be expressed through:
AFS Grain Fineness Number (GFN).
Surface area.
Percent fines.
Individual screens.
Permeability.
When performing the permeability test, it is important to keep in mind that while sand size is the biggest influencer, other variables can affect permeability, such as moisture and clay levels.
Grede-St. Cloud runs a permeability test every time it runs lab green sand tests—every two or three hours. The casting facility conducts the other four size distribution tests, which are more labor-intensive, daily and plots the results on a run chart. Sand casting operations that are performing these tests less frequently than weekly are opening themselves up to missing a problem. It’s also important to build a history of normal ranges to be able to determine when something is not operating regularly.

Table 1 shows results from two different values used to define sand size, GFN and surface area. GFN tends to emphasize coarser grains where surface area emphasizes fine grains. So, if a shop is more susceptible to having problems with sand becoming too fine, the surface area numbers should be used. If a shop trends to coarse sand, it should pay closer attention to the GFN results.
Vendors deliver new sand to a set specification, but it can range from the high or low end of that specification. Because not much can be done with the new sand, improving permeability or size distribution in the plant is done by adjusting the dust collection system through key collection points in the facility—such as by the conveyor discharge points, rotary screen or coolers. If the sand in the system is too fine, open up the draw more at the key collection points. If the sand is too coarse, close the draw a little.
At Grede-St. Cloud, some jobs are highly cored while others have little core input. When the facility is running highly cored jobs with fresh new sand, the sand in the green sand system can become too coarse. If not enough fines are available, it may be necessary to adjust the grade or amount of sand added directly to the green sand system. It’s not recommended to adjust the core sand grade because that could affect core strength.
Variation in the sand mix inhibits the ability to produce consistent, quality castings. In order to eliminate the variation, a good sand testing program will include daily tests and then use the resulting data to monitor and make adjustments to the system as needed.


Comments